Trip Viewer
A fully embeddable, zero-dependency trip visualization widget built on Google Maps. Drop it into any web application with a single iframe and give your users an interactive, production-ready map experience for telematics trip data.
Why Trip Viewer
Traditional trip visualization requires building custom map integrations, handling multiple data sources, managing UI controls, and maintaining compatibility across devices. Trip Viewer eliminates all of that.
- One line of HTML to embed a full-featured trip map
- URL-driven configuration — every setting is a URL parameter, no JavaScript API to learn
- Works with processed and raw GPS data — compare server-calculated routes against raw device traces
- Self-hosted — deploy on your infrastructure with Docker, keep data under your control
Features
Route Visualization
Display trip routes on an interactive Google Maps canvas with automatic zoom-to-fit, start/end markers, and smooth polyline rendering.
- Processed trip route — server-calculated path with speed and phone usage segments color-coded directly on the polyline
- Raw GPS route — raw device GPS trace for diagnostics and data quality inspection
- Overlay mode — view both routes simultaneously with processed data at reduced opacity, making it easy to spot deviations between processed and raw data
Driving Events
Incident markers appear on the map at the exact location where driving events occurred. Each marker is clickable, revealing intensity, timestamp, and coordinates.
- Acceleration — sudden acceleration events
- Braking — harsh braking events
- Cornering — sharp turn events
- Events are shown on both processed and raw data with independent visibility controls
Speed Analysis
Identify speed violations across a trip with configurable thresholds.
- Absolute threshold — highlight every waypoint exceeding a fixed speed (e.g., 80 km/h)
- Posted speed limit — highlight every waypoint exceeding the road's actual speed limit
- Cluster mode — group nearby violation markers into clusters for cleaner visualization on long trips
- Max speed point is always highlighted, even when no threshold is set
Speed Activity Heatmap
Color the entire route polyline by speed to classify movement types at a glance. This is the primary tool for users who record persistent tracking data (driving, walking, running, and mixed activities).
| Activity | Color | Speed (km/h) | Speed (mph) |
|---|---|---|---|
| Stationary | Gray | 0 – 2 | 0 – 1 |
| Walking | Green | 2 – 7 | 1 – 4 |
| Running / Cycling | Light green | 7 – 25 | 4 – 16 |
| Urban driving | Yellow | 25 – 60 | 16 – 37 |
| Highway driving | Orange | 60 – 120 | 37 – 75 |
| Excessive speed | Red | > 120 | > 75 |
- Works on both processed and raw data
- Automatically converts thresholds between km/h and mph based on the unit system
- On-map legend shows color key with speed ranges
GPS Accuracy Heatmaps
Three specialized heatmap modes for raw GPS data quality analysis. Each colors the route polyline segment-by-segment based on a sensor accuracy metric.
- GPS Accuracy — horizontal position accuracy in meters (green < 5m through red > 60m)
- Speed Accuracy — speed measurement accuracy in m/s (green < 1 through red > 12)
- Vertical Accuracy — altitude accuracy in meters (green < 3m through red > 50m)
These modes help QA engineers and support teams quickly identify trips with poor GPS reception, signal drift, or device issues.
Waypoint Inspector
Enable clickable dot markers on processed and/or raw routes. Click any dot to open a detail panel with full waypoint data.
Processed waypoints show:
- Speed, speed limit, speeding status
- Phone usage detection
- Coordinates, time, elapsed time since trip start
Raw GPS waypoints show:
- Speed, altitude, course
- GPS accuracy, speed accuracy, vertical accuracy
- Screen/device/GPS status flags
- Active heatmap metric highlighted in the popup
Trip Replay
Scrub through the trip timeline with an animated marker that moves along the route.
- Slider — drag to any point in the trip timeline
- Play/Pause — auto-advance the marker along the route
- Speed controls — 1x, 2x, 4x, 8x playback speed
- Info panel — shows real-time speed, coordinates, time, and source label at the current position
- Directional marker — the replay pin rotates to face the direction of travel
- Uses processed or raw data (or both) depending on the active view mode
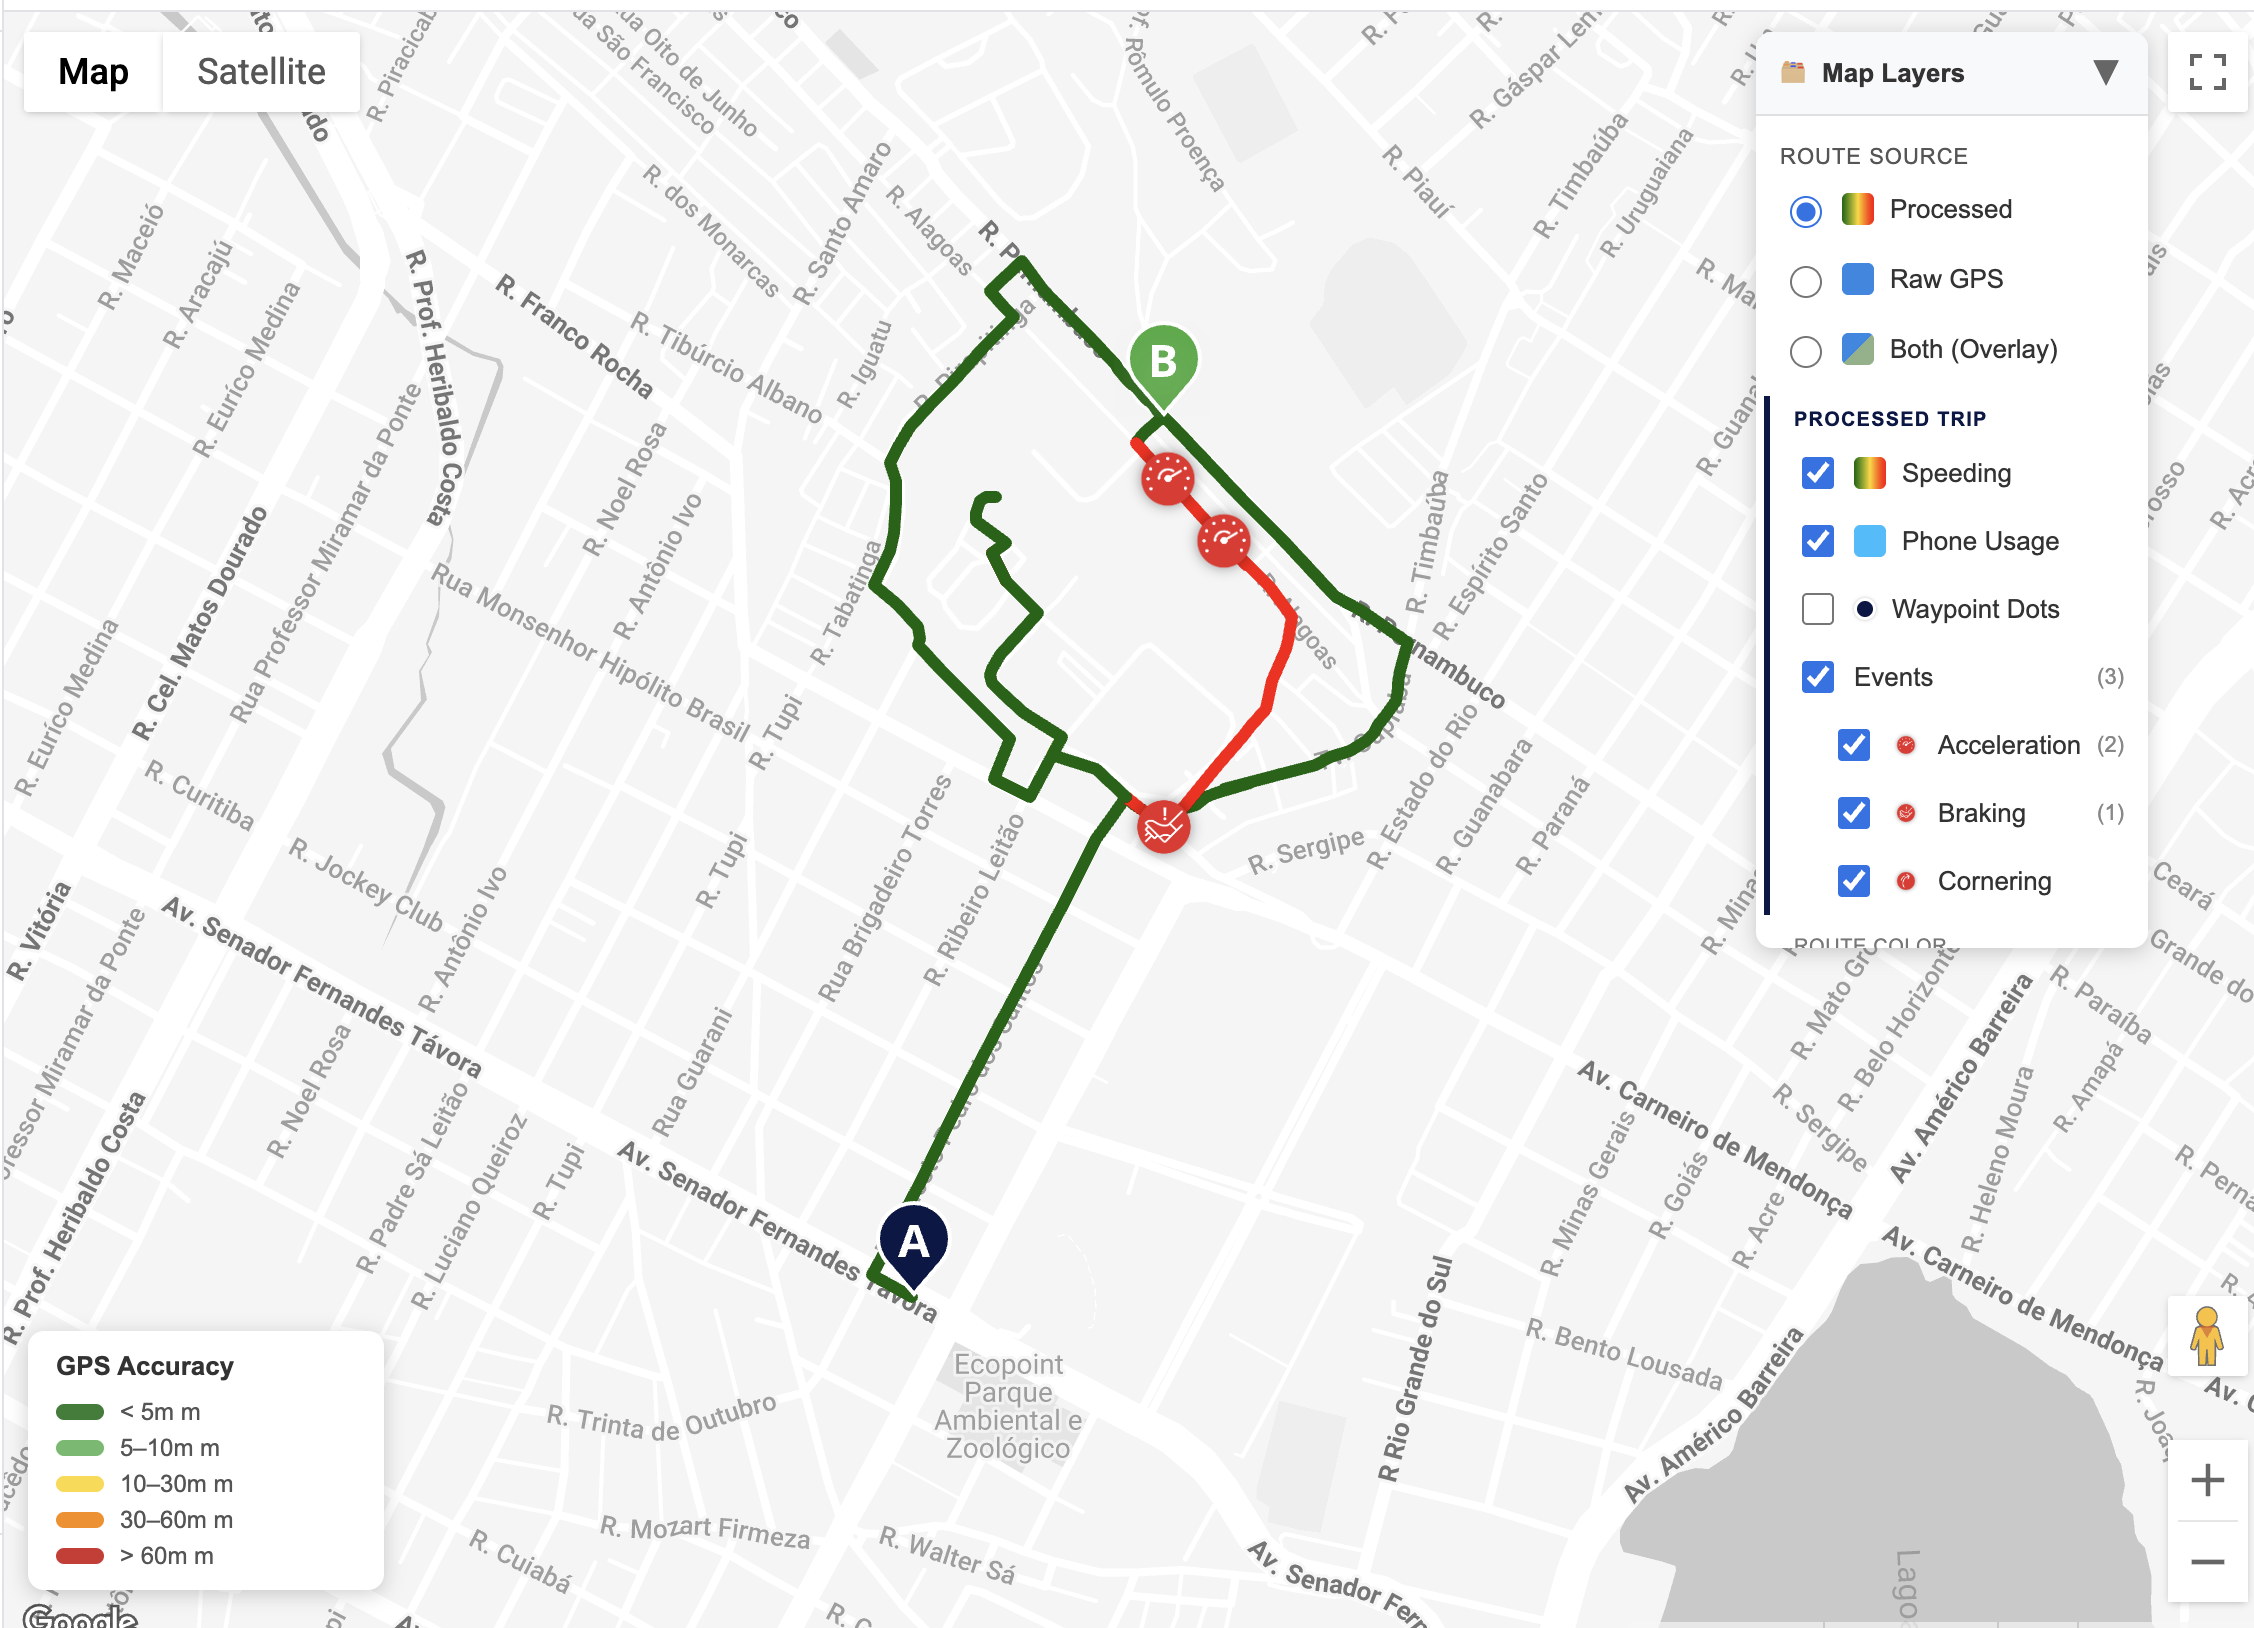
Layers Panel
An interactive control panel on the map that lets users toggle visibility of every data layer.
- Grouped by data source (Processed Trip / Raw GPS Trip) for clear organization
- Individual toggles for speeding, phone usage, events, waypoint dots
- Route source radio buttons (Processed / Raw / Both)
- Heatmap mode dropdown
- Preferences persist in localStorage, URL parameters always override
- Can be hidden entirely for clean embeds (
hideLayers=true)
Unit System Support
All speed, distance, and threshold values respect the configured unit system.
- Metric (Si) — km/h, meters
- Imperial — mph, feet
- Heatmap legends, speed labels, and all UI elements automatically adapt
Use Cases
Fleet Management Portals
Embed trip maps in fleet dashboards to let managers review driver trips, identify speeding violations, and assess driving behavior. Use the speed compliance view to highlight policy violations.
?Token=TOKEN&trackId=TRACK_ID&userId=USER_ID&speedThreshold=80&clusterSpeed=trueInsurance Telematics
Show policyholders their driving score breakdown with incident markers and speed analysis. Use the compact embed mode for clean widget integration.
?Token=TOKEN&trackId=TRACK_ID&userId=USER_ID&hideLayers=true&showReplay=falseFitness and Activity Tracking
Use the speed activity heatmap to classify movement types — distinguish walking segments from cycling and driving on a single persistent tracking session.
?Token=TOKEN&trackId=TRACK_ID&userId=USER_ID&heatmapMode=speedActivityGPS Data Quality Assurance
Raw GPS accuracy heatmaps help QA teams identify device issues, poor signal areas, and data quality problems before they affect downstream analytics.
?Token=TOKEN&incomingTrackToken=RAW_TOKEN&userId=USER_ID&heatmapMode=gpsAccuracy&showRawDots=trueTrip Comparison and Debugging
Overlay processed and raw routes to compare algorithm output against ground truth. Useful for route-matching validation and SDK tuning.
?Token=TOKEN&trackId=TRACK_ID&userId=USER_ID&incomingTrackToken=RAW_TOKEN&viewMode=both&showProcessedDots=true&showRawDots=trueDetailed Trip Analysis
Full-featured view with all data points visible, replay enabled, and both data sources overlaid.
?Token=TOKEN&trackId=TRACK_ID&userId=USER_ID&incomingTrackToken=RAW_TOKEN&viewMode=both&showProcessedDots=true&showRawDots=true&showReplay=trueQuick Integration
Step 1: Embed with an iframe
<iframe
  src="https://your-host.com/spa/trip-viewer/?Token=YOUR_TOKEN&trackId=TRIP_ID&userId=USER_ID"
  width="100%"
  height="600"
  frameborder="0"
  style="border: 1px solid #e0e0e0; border-radius: 8px;"
  allow="fullscreen"
  title="Trip Viewer"
></iframe>
Step 2: Choose your authentication
| Method | Parameter | Best for |
|---|---|---|
| Short-term token | Token | Embedded/iframe scenarios — generate a short-lived token from your backend. Recommended for production. |
| JWT | accessToken | Direct access when your backend already has a Damoov JWT. |
Step 3: Configure via URL parameters
Every aspect of the viewer is controlled by URL parameters. No JavaScript SDK, no callbacks, no event listeners — just append parameters to the URL.
| Category | Key parameters |
|---|---|
| Data source | trackId, incomingTrackToken, viewMode |
| Display | showSpeeding, showPhoneUsage, showEvents, showProcessedDots, showRawDots |
| Analysis | speedThreshold, clusterSpeed, heatmapMode |
| UI | hideLayers, showReplay, unitSystem |
Step 4: Dynamic URL construction
function buildTripViewerUrl(options) {
  const base = 'https://your-host.com/spa/trip-viewer/';
  const params = new URLSearchParams();

  params.set('Token', options.token);
  params.set('trackId', options.trackId);
  if (options.userId) params.set('userId', options.userId);
  if (options.unitSystem) params.set('unitSystem', options.unitSystem);
  if (options.heatmapMode) params.set('heatmapMode', options.heatmapMode);
  if (options.hideLayers) params.set('hideLayers', 'true');

  return `${base}?${params.toString()}`;
}
Step 5: Make it responsive
<div style="position: relative; width: 100%; padding-bottom: 56.25%; height: 0; overflow: hidden;">
  <iframe
    src="https://your-host.com/spa/trip-viewer/?Token=TOKEN&trackId=TRACK_ID"
    style="position: absolute; top: 0; left: 0; width: 100%; height: 100%; border: none;"
    allow="fullscreen"
    title="Trip Viewer"
  ></iframe>
</div>
URL Parameters at a Glance
| Parameter | Type | Default | Description |
|---|---|---|---|
accessToken | string | — | JWT authentication token |
Token | string | — | Short-term token (takes priority over JWT) |
trackId | string | — | Processed trip identifier |
incomingTrackToken | string | — | Raw GPS trip token |
userId | string | — | User/device identifier |
unitSystem | string | Si | Si, Metric, or Imperial |
viewMode | string | auto | processed, raw, or both |
heatmapMode | string | off | speedActivity, gpsAccuracy, speedAccuracy, verticalAccuracy |
speedThreshold | number/string | off | Absolute speed or maxspeed |
clusterSpeed | boolean | false | Cluster speed violation markers |
showSpeeding | boolean | true | Speeding segments on processed route |
showPhoneUsage | boolean | true | Phone usage segments on processed route |
showEvents | boolean | true | Incident markers on processed route |
showRawEvents | boolean | false | Incident markers on raw route |
showProcessedDots | boolean | false | Clickable waypoint dots on processed route |
showRawDots | boolean | false | Clickable waypoint dots on raw route |
showReplay | boolean | true | Trip replay bar |
hideLayers | boolean | false | Hide the layers panel |
Deployment
The Trip Viewer ships as a Docker container with a Node.js server that handles API proxying and static file serving.
# Local development
docker-compose up --build
# → http://localhost:8080/trip-viewer

# Production
docker pull damoov/spa-server:latest
docker-compose -f docker-compose.prod.yml up -d
All external API domains are configurable via environment variables:
| Variable | Default | Purpose |
|---|---|---|
API_TARGET | https://api.telematicssdk.com | Processed trip API |
LOWCODE_TARGET | https://lowcode.telematicssdk.com | Short-term token proxy |
RAW_API_TARGET | https://portal-apis.telematicssdk.com | Raw GPS data API |
ASSETS_CDN | https://damoov-shareddocuments.s3... | Static assets (icons) |
GOOGLE_MAPS_KEY | (built-in) | Google Maps API key |
Updated 2 months ago